Sally K. Norton

Vitality Coach, Speaker & Health Consultant

  • Home
  • About
    • Interviews and Talks
  • Symptoms
  • Relief
    • Nourishment
    • Results
  • Science
    • Oxalate Basics
  • Book
  • Support
    • Upcoming Events
    • Support Groups
    • Shop / Download
    • Sign-up for News and Updates
    • Speaking and Presentations
    • Coaching and Consulting Services
  • Recipes
    • Fundamentals
    • Sauces and Condiments
    • Beverages
    • Finger Foods
    • Soups
    • Salads
    • Side Dishes
    • Meats and Seafood
    • Treats
  • Blog
    • Table of Contents
  • Contact
    • Share Your Success Story!
    • Coaching and Consulting
    • Speaking
    • Webmaster
    • Privacy Policy

September 4, 2022 by Sally K Norton

Oxalates in Foods: How To Make Sense of the Data

Tape measure wrapped around avocado fruit

Starting a low oxalate diet? Going low oxalate can be a huge step into a brand-new world. It’s not only unfamiliar but somewhat disorienting. What to eat? How much to eat? What should your new staples be? How will you learn and remember which foods are high in oxalate? You need practical guidance—and a bit of data on how much oxalate is in your foods.

Oxalates in Foods:
Hard to Measure and a Bit Confusing.
Photo by Jennifer Burk on Unsplash

When you’re researching the oxalate content of foods, where do you turn first? Probably Google. But most internet sites offer scant information laced with factual errors. As you comb through the search results for that list of oxalate-rich foods, you could easily find different websites that don’t agree with one another. A given food may be listed as high on one site and low on another. The lists are also often short, with just a few foods listed. The “top ten” is far from the whole story!

Obviously, the easy-to-find data isn’t especially good. And this mess can be a big, discouraging curve-ball. Don’t let all this conflicting information and lack of consensus among various data resources get you down! It is still possible to succeed in adopting a healthier, oxalate-aware way of eating.

Still, making sense of the data can overwhelming and confusing. It was for me, despite my nutrition education and professional experience. To get you oriented and make you more fool-proof, let me walk you through the mine-field of oxalate content confusion.

Online Lists Will Keep You Feeling Confused About Oxalates in Foods

How can you tell which information is credible? You won’t know just by looking at the list. Fame and fortune (institutional reputation such as USDA, Harvard, or WebMD, for example) do not assure you that a list is correct.

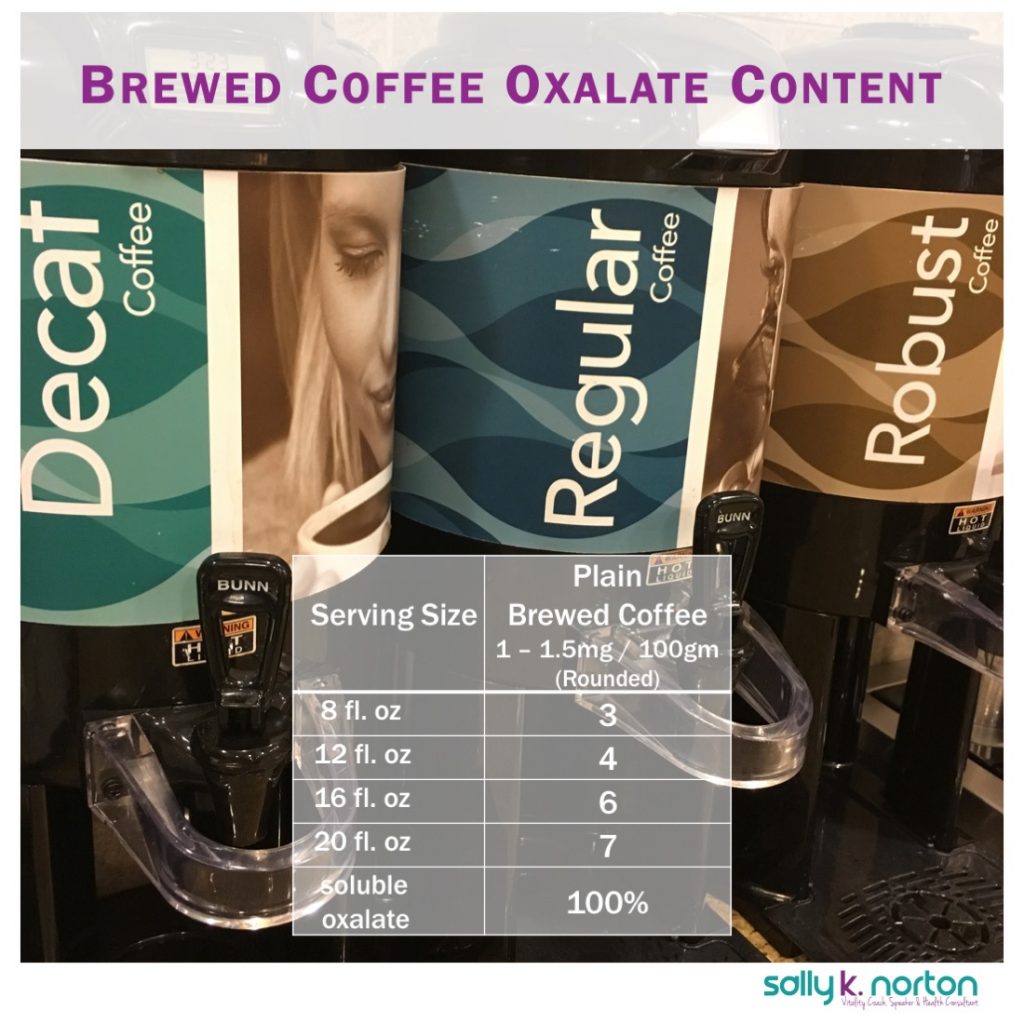
Misinformation about oxalates is widespread, especially among mainstream sources! For example, there’s one false claim that dates are high in oxalate posted on WebMD and thus elsewhere. (Please see my short post on the error with dates here, coming next week). There is also confusion about oxalate content in coffee because some researchers claim coffee is a high oxalate food. Neither is true. Multiple credible sources prove that in both cases, the sites listing dates and coffee as high oxalate are wrong. But mistaken notions persist. And mistaken data goes uncorrected.

Most list makers fail to mention where they got their information, let alone who did the testing and by which methods. Nor do the list makers bother to explain their rationale for designating foods as “high” or “low” in oxalate. And they rarely (if ever) revisit old information and update it.

Since the online lists aren’t good enough, surely medical journals, health agencies, and academia must have trustworthy numbers, right? But if you put on your thinking cap and take a deep dive into the literature, you might have a hard time finding much. In the end, what you manage to dig up from professional papers is also conflicted and confusing. It’s frustrating and frankly shocking how difficult it is to find credible, consistent resources on oxalates in our foods.

The full value of low-oxalate eating is not yet well-known, and sufficient resources have not been assigned to the necessary work.

Oxalate Data Online is a Mess!
Photo by Magnet.me on Unsplash

Despite the jumble of imperfect science, incomplete data, and untrustworthy conclusions about what amount is safe to consume, we can still find our way to low oxalate eating and heal from oxalate toxicity.

How to Get Better Information

Despite the data muddle, you can transition to this eating strategy successfully. Start with my Beginners’ Guide. This vetted, trustworthy list will get you 90% of the way there.

Read on if you want to understand more about the state of oxalate data and why it can be challenging. Remember that enduring some confusion is part of learning.

In the remainder of this post, I’ll attempt to explain the reasons for the discrepancies in oxalate data.

Better Sources Exist for Oxalates in Foods

I want to reassure you that there is enough credible information to support low-oxalate eating. Today we have more knowledge than ever before on oxalate in foods and how they impact health. The work of The VP Foundation and Susan Owens’ Trying Low Oxalates Facebook group has helped to launch our emerging era of growing awareness of oxalate overload. As more of us discover the healing benefits, our growing oxalate-aware community can continue to improve the data, making it more accessible, understandable, and usable over time. Most importantly, we all need to advocate for more food testing.

For a better understanding of the oxalate content of foods and using oxalate data, keep the following five tips in mind.

Need to Know Tip #1: Oxalate Levels Vary for the Same Kind of Food.

Plants naturally produce oxalates for survival to ward off microorganisms, fungi, and plant eaters. It also helps them to discard excess calcium they pick up from soils.

Oxalate levels can also vary between different types of the same food. Let’s look at apples as an example, which have over 7,500 varieties grown worldwide. I know of only 24 tests of apples. An Egyptian study found an apple of average size (~ 6 oz) had 15 mg of oxalate, but it doesn’t indicate which type of apple. Meanwhile, other tests conducted in the US found that a Pink Lady apple contains 2 mg of oxalate, a Gala has 2 to 5 mg, and a medium Granny Smith contains 5 mg. Based on a set of tests done for the VP Foundation, variations in oxalate content between varieties of tomatoes is far wider.

Situational factors such as soil content, pH, and weather can impact how much oxalate each plant contains. Unless you test every individual fruit, vegetable, or slice of bread you eat, it’s impossible to know exactly how much oxalate it has. Research reports typically don’t indicate variety, maturity, and other factors with their test results.

How much oxalate is in an avocado?
Photo by Towfiqu Barbhuiya on Unsplash

Current research typically does not seriously investigate variability in foods. And we don’t know how much each type varies and what factors influence this variability. Different growing conditions may explain the difference between US-grown apples and those grown in Egypt. Thankfully, the amounts in apples are relatively low. 

Many foods, herbs, and supplements have only been tested (and reported) once. This means we are unsure of the estimated content for these rarely tested items. Because of natural variation and limited testing, I suggest that you think about the numbers around oxalate levels as somewhat “fuzzy.”

Need to Know Tip #2: Oxalate in Foods Information is Incomplete

What really brings us garbage data are the human factors. It might be the testing method used, sloppy execution of the testing, or inaccurate reporting that explain the 5-times higher oxalate content of the Egyptian apple, and not the apples’ natural variability after all. Without more resources and interest by researchers, we don’t know.

We need to retest many foods to understand the extent of this variability, reveal mistakes, and reduce confusion around the oxalate content of what we eat.

Additionally, plants produce two types of oxalates. The first, oxalic acid, is soluble and is easily absorbed into your bloodstream. The second, oxalate crystals, are insoluble, irritate your digestive tract, but probably don’t enter the bloodstream. Both types of oxalate can impact your body, but in different ways. Many reports don’t make this critical distinction. Only recently has it become common for researchers to distinguish between the two categories of oxalate in their reporting. This can add to the confusion.

What can I eat on a low oxalate diet?
Photo by Thought Catalog on Unsplash

Need to Know Tip #3: Sloppiness is Widespread

Some researchers use unreliable methods in their analysis. (See my coffee post on this problem.) In another case, testing done for the VP Foundation mistakenly used too small a sample in testing oils and got numbers overstating their oxalate content, which is in reality essentially zero. Later, they repeated the testing and reported corrected data. But in both cases the old, wrong data continues to circulate.

Many reports also fail to mention food preparation—such as whether something was tested raw, steamed, boiled, or fried—which can significantly impact oxalate levels and the data’s usefulness for estimating how much oxalate you are eating. All of these factors can create bad data.

There may also be simple data entry mistakes (aka, “typos”) causing confusion. Even our most reliable source of oxalate data, the VP Foundation, has reported several items incorrectly. For example, when they calculated the oxalate in one ounce (28 grams) of sweet potato chips, they mistakenly used “17 grams” instead of 28 grams because one ounce is about 17 chips. Thus, they mis-reported the amount of oxalate per one ounce serving as (37 mg oxalate), which is much lower than it really is (60 mg). 

Two tree fruits compared. Cluster of 3 tamariallo fruits on left, one tamarind pod on right.

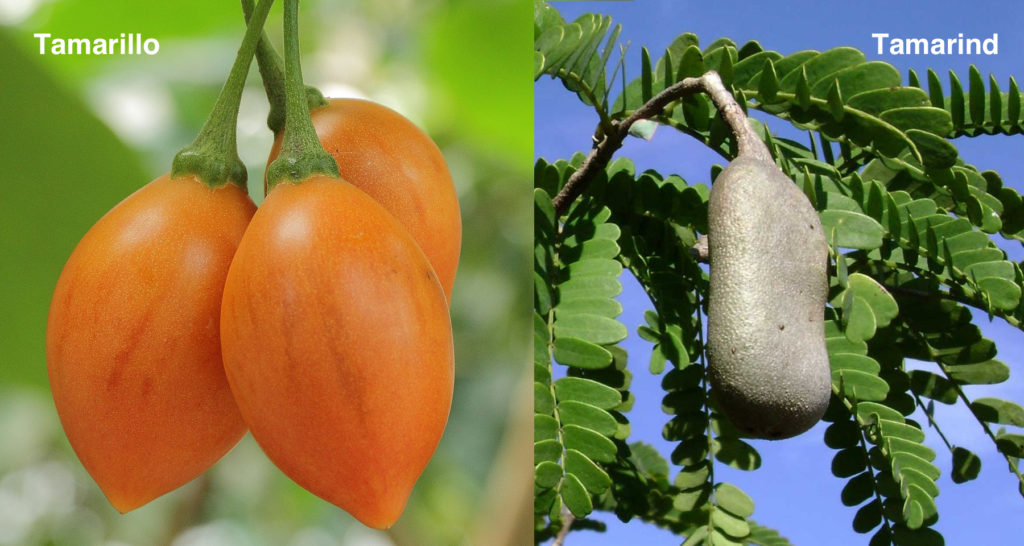
Tamarillo and Tamarind are not the same thing

Here’s another example of a reporting error: the experienced German researchers, Hönow and Hesse, said they tested “tamarillo” (a Central and South American tree fruit in the nightshade family) but they described it as “tamarindus indica” (the Indian fruit taramind). Those are entirely different foods, and we don’t know which one they tested. Thus, it’s garbage data, and probably worse than useless.

I’m not bashing anyone with these examples. What you need to realize is this: These mistakes are very easy to make. Even the best data sources contain them. You need to use your head when looking over the data.

Data discrepancies and misunderstandings about oxalates in foods could have critical implications for our health. The scientific community needs to step up to ensure they are not the reason for the confusion. Unfortunately, taking the time to get the facts right is an unusual approach!

Need to Know Tip #4: Older Oxalate Testing Methods Were Less Accurate

Prior to 1980 or so, the usual testing was prone to error. One important source of error affected tests of foods that have very little oxalate but contain abundant vitamin C. For example, the USDA data (published in dietitians’ handbooks) states that radishes are high in oxalate. But they are, in fact, very low. If the vitamin C in the radishes degraded to oxalate during testing it might be a partial explanation for the error. Or, perhaps it’s just bad data management, yet again.

Accurate testing continues to be challenging, but more recent testing tends to offer more reliable information.

Need to Know Tip #5: Oxalate Data Researchers do not Calculate Portion Sizes

To make things more complex for consumers, researchers often don’t translate their numbers into amounts per typical portion size in their reporting. They might, for example, present the results based on the dry weight without calculating the oxalate content of the food as it is normally consumed (including the moisture that was removed before analysis).

How do I know how much oxalate is in the foods I eat?
Photo by Louis Hansel on Unsplash

Let’s go back to the coffee example. One test of instant coffee found 57 mg oxalate per 100 grams of coffee powder. That sounds like a lot! As I explained in my blog post about coffee, you only use one-half to one gram of instant coffee to brew a cup.

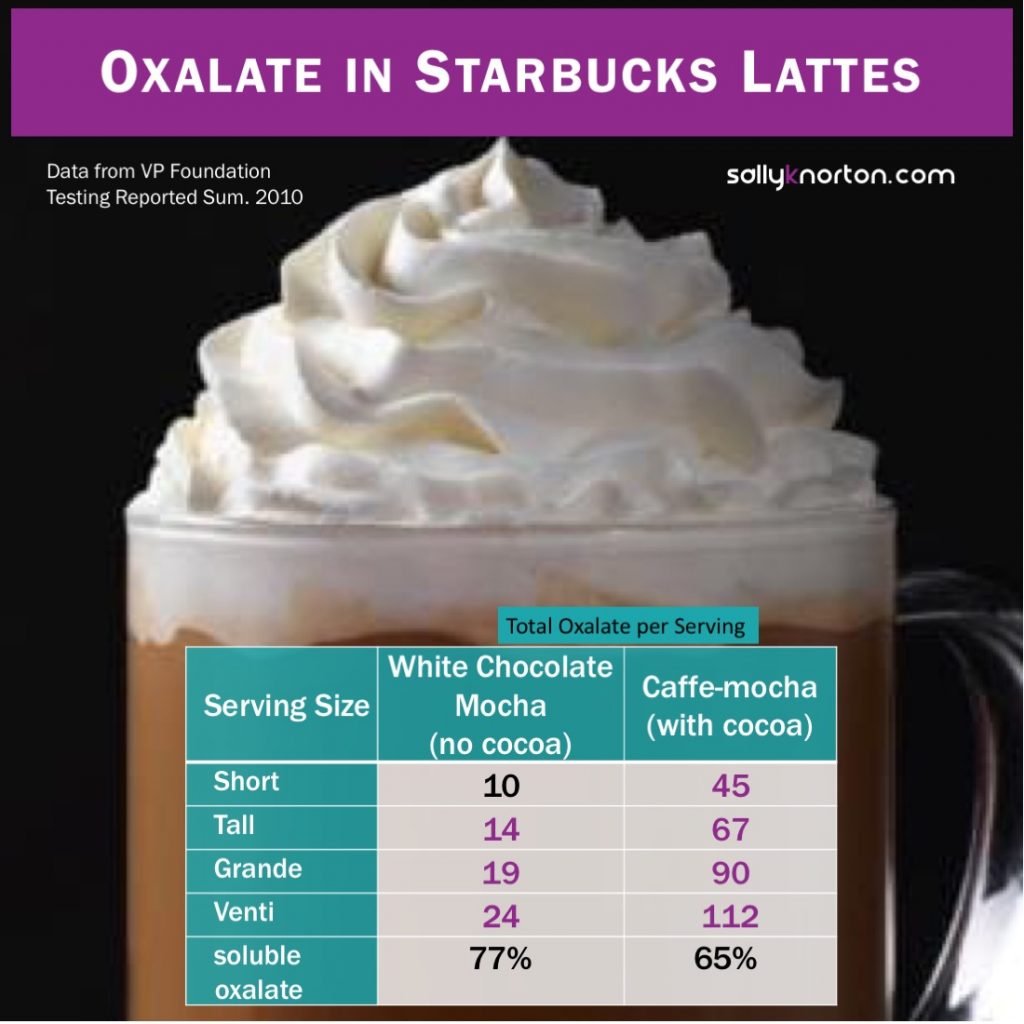
Unless you’re choking down an entire cup of undiluted instant coffee powder—or adding high oxalate ingredients like cocoa to make a mocha—coffee is a low-oxalate food. Even if you drink a Venti dark roast from Starbucks every morning (which I don’t recommend because of the caffeine and other chemicals in coffee), you’re not drinking very much oxalate. In addition to how it’s prepared, portion sizes will impact how much oxalate you consume. Researchers need to do a better job at taking portion sizes into account when publishing reports so that consumers can use the data correctly.

We Need More (and Better) Research on Oxalates in Foods

There are significant knowledge gaps in the current literature regarding oxalates in foods and oxalate toxicity. More research is required to understand how much oxalate various foods contain, how much it varies from one variety to another (or for other reasons such as ripeness), and to weed out the technical errors and mistaken conclusions that linger in obsolete publications and in the minds of researchers, doctors, and the unsuspecting public. Unfortunately, “weeding” of medical literature is not something journals have any incentive to bother with, and it is difficult to execute.

It’s enough to make anyone’s head spin, but I have good news: going low oxalate isn’t about bean-counting. It isn’t about strictly accounting for everything you eat or measuring the exact amount of oxalate down to the milligram.

This isn’t Weight Watchers. I dislike tracking everything I eat. It can be distracting, demanding, and impractical. You can successfully lower your oxalate intake without sweating the data details. However, if you love to track things, please do. It will help if you know what you actually ate instead of just what you remember eating.

Practice Tip #1: You Don’t Have to be Perfect

Going low oxalate is about awareness and consistency, not perfection. We have enough information about oxalates in foods that we can make educated decisions about how to structure our diets without getting too hung up on what we’re eating.

Despite the limitations of oxalate data, we know that certain foods are reliably low in oxalate, including meat, poultry, dairy products, fats, true lettuces, white rice, several herbs (dill and thyme, for example) and spices (white pepper, mustard, cayenne pepper), as well as most vegetables in the cabbage family. If you build your diet around these staple foods, you will have no trouble keeping your oxalate levels in a safe range.

Practice Tip #2: Portion Size Matters

Portion size is critically important. Eating one bite of a high-oxalate food, like chocolate cake, is very different from eating an entire slice. Another example would be choosing ONE (normal-sized) chocolate chip cookie instead of a fudge brownie or mug of hot cocoa. While I don’t recommend throwing caution to the wind, you don’t need to sweat occasionally eating a tiny amount of high-oxalate foods (like a few chocolate chips).

We can learn as a community and advocate for better oxalate information.
Photo by Valiant Made on Unsplash

For example, spinach is a high-oxalate food I recommend avoiding. However, if you order a salad at a restaurant, realize some spinach leaves are mixed in, and you accidentally ate one or two of them, don’t worry: you won’t cause more oxalate to collect in your body. Just pick out the rest of the leaves and make sure the remainder of your meal is built around lower-oxalate foods. In fact, by eating small amounts of oxalate, you might avoid or delay heavy oxalate clearing symptoms. That is a good thing.

On the other hand, giving yourself permission to ignore what you’re eating can be a mistake. For example, taking several solid bites of an intense fudge brownie has the potential to bring on symptoms within one to five hours after the indiscretion. It’s not tragic if it happens, but it’s also easy to avoid if you pay attention.

Practice Tip #3: Keep Learning

Going low oxalate is a nuanced process, and there’s always more to learn. As you transition into low-oxalate eating, I’m here to help you make sense of the information that’s out there.

Get the “big rocks” right by using my Beginner’s Guide to trim out the worst offenders and adopt the “safe bets.” The middle ground foods? I’ll help you with that too, but don’t sweat them in the first phase of getting off the dangerously high foods. Tables available via my group meetings and in my book, Toxic Superfoods, will give you further guidance. For lots of specific data, my forthcoming Oxalate Data Resource Manual will provide you with all the particulars currently available for refining your oxalate-aware diet.

June 29, 2019 by Sally K Norton

What Is the Oxalate Content of Coffee?

Oxalate Content of Coffee

One of the most common questions I get when people hear about the health dangers of oxalates is whether coffee is “low” or “high” in oxalate. It’s a good question. After all, most everyone I know depends heavily on coffee to function. This article is not about the wisdom of your caffeine addiction, however. It’s about knowing how much oxalate you’re (not) consuming. To this end, I compiled all the published analyses of the oxalate content of coffee I could find in an attempt to understand why this is a question at all.

It should not have surprised me that looking to scientific reports for answers unearthed a golden example of how bad science comes to pass for truth. We the public don’t know when terrible science is influencing our thinking or inflaming our fears about oxalate in coffee. And we are easy dupes. Our tweet-sized attention span and resistance to technical details makes us headline readers, not thinkers.

Here we enter a bit of a rabbit hole for a good cause. That cause has multiple aims: 1) to improve your confidence that coffee is indeed low in oxalate, 2) raise your awareness that academic journals publish junk science and generate misinformation and, 3) provide an object lesson in the value of taking some time to read the fine print.

Popular Summary Lists Mostly Think the Oxalate Content of Coffee is Low

Lists of high and low oxalate foods from medical centers mostly agree that coffee is low in oxalate (see Table 1. Online Patient-Education Lists from 4 North American Medical Centers). Agreement does not necessarily make them right, nor has it vanquished the ubiquitous confusion about coffee’s oxalate content. Urologists, the public, and even the researchers can’t get or give a straight or consistent answer about oxalate levels. Some medical researchers and clinicians believe that coffee is high in oxalate. I have friends in the medical field who believe it. And they use it as an excuse to resist learning about oxalate or controlling how much they consume. Any threat to the love of their life (coffee) will not be brooked.

Still, there are two solid scientific reasons to believe that coffee is very low in oxalate. The first is that all reputable testing to date has demonstrated that coffee is low in oxalate. The second is the real-world experience of low-oxalate dieters who have maintained a daily coffee habit with health benefits and without signs of oxalate-related symptoms. Other beverages, including hot chocolate, black tea, and green tea, have consistently been found to be high in oxalate and tend to trigger oxalate-related effects (the effects are variable—e.g. night-time irritable bladder).

I have a suspicion that the rumor about coffee being high oxalate originated in confusing reports on the oxalate content of instant coffee powder, which led to misinterpretation of the results. Instant coffee is indeed very high if you eat a whole cup of the undiluted powder. However, no one does that! Instead only about 2g is dissolved in a cup of hot water. The University of Pittsburgh’s patient education lists (Table 1) use a seemingly escalated number for instant coffee (greater than 10 mg per cup). Perhaps their source mistook the powdered coffee’s oxalate content for what is present in a reconstituted cup.

Table 1.

Online Lists of Oxalate Content of Foods

From North American Medical Centers (Patient Education Materials)
List SourceType
(Plain Coffees)
Oxalate ContentURL
Univ. ChicagoRegular Brewed Coffee1 mg/Cuphttps://kidneystones.uchicago.edu/how-to-eat-a-low-oxalate-diet/
Univ. ChicagoDecaffeinated2 mg/Cuphttps://kidneystones.uchicago.edu/how-to-eat-a-low-oxalate-diet/
Univ. HarvardBrewed1 mg/Cuphttps://docs.google.com/spreadsheets/d/1nbDZPxhAW4It-m2-c460w6eGr4dMSIeDiQdqg3MaRgQ/edit#gid=1354389148
Univ. Pittsburgh (2003, PK Diet PDF hosted elsewhere)Instant coffee powder"Extremely High"http://www.pkdiet.com/pdf/LowOxalateDiet.pdf
Univ. PittsburghBrewed"Moderately High"
(2-10mg/Cup)
https://www.upmc.com/-/media/upmc/patients-visitors/education/unique-pdfs/low-oxalate-diet.pdf or
http://praveenmodimd.com/wp-content/uploads/2016/01/Low-Oxalate-Diet-_-Patient-Education-Materials-_-UPMC-Pittsburgh-PA.pdf
Univ. PittsburghInstant Coffee>10 mg/Cuphttps://www.upmc.com/-/media/upmc/patients-visitors/education/unique-pdfs/low-oxalate-diet.pdf or
http://praveenmodimd.com/wp-content/uploads/2016/01/Low-Oxalate-Diet-_-Patient-Education-Materials-_-UPMC-Pittsburgh-PA.pdf
St. Joseph’s Healthcare Hamilton, ON, Canada (2016)Coffee and decaffeinated coffee“good choice”https://www.stjoes.ca/patients-visitors/patient-education/patient-education-k-o/pd-9447-oxalate-in-food.pdf

Instead of relying on shaky lists, let’s go to the primary sources to consider results reported by credible researchers regarding the oxalate content of coffee.

Published Analyses of the Oxalate Content of Coffee

Oddly, published tests of the oxalate in coffee are relatively few. Perhaps this is because virtually all historically reported tests have found both brewed and instant coffee to be “very low” in oxalate for typical serving sizes (see Table 2. Publications Reporting Oxalate Content in Coffee: Plain and Two Flavored Coffees). There are two articles listed in Table 3 that claim coffee is high in oxalate. I will examine these articles in detail below.

Given that the question appears to be resolved, perhaps that is why testing coffee seems to be uninteresting to researchers. Nobody gets published in a quality journal if they’re reporting one more example of the same old uninteresting result. Lack of interest may perpetuate confusion regarding oxalate content in coffee, as it does for so many other foods.

Table 2 lists 11 published results (from 8 sources) reporting the oxalate content of coffee. These tests analyzed various types of coffee (instant and brewed), as well as two Starbucks flavored coffees. The researchers used a variety of analytical methods.

Coffee cup with question: what is in your cup?

The rightmost column in Table 2 reports milligrams of oxalate in an eight-ounce serving (237 ml). Instant and unflavored brewed coffee have somewhere between 0.7 and 2.4 milligrams of oxalate per cup. Flavored coffees may have higher oxalate content coming from ingredients other than the coffee.  In particular, notice that a Starbucks mocha latte has 47 mg of oxalate per cup, which is high – but at least 80% of that oxalate is coming from the (chocolate) mocha.

Keep in mind that today’s mugs, like our waistlines, have gotten rather large.  Eight ounces is roughly what you get in a “short” Starbucks cup. A typical small takeout coffee is usually twelve ounces (Starbucks “tall”), a medium size is 16 ounces (Starbucks “grande”), and a large is 20 ounces (Starbucks “venti”). Scale the oxalate results accordingly. Portion size always makes a difference, but fortunately coffee is low enough that the oxalate hit even from a large-sized unflavored coffee won’t be especially dramatic.

Table 2

Publications Reporting Oxalate Content in Coffee:

Plain and Two Flavored Coffees
YearReferenceAnalytical MethodVariety TestedData as reportedMg Per 8 ounce (237 ml) serving
1962Zarembski and Hodgkinson ((Zarembski PM, Hodgkinson A. The oxalic acid content of English diets. British Journal of Nutrition. 1962;16(01):627. doi:10.1079/BJN19620061))Colorimetric determination of ether-extracted, acid-processed sampleNescafe Instant powder 57mg/100g powder0.7
(Estimated as if prepared using 0.5 g powder per 100 ml)
1962Zarembski and Hodgkinson ((Zarembski PM, Hodgkinson A. The oxalic acid content of English diets. British Journal of Nutrition. 1962;16(01):627. doi:10.1079/BJN19620061))Colorimetric determination of ether-extracted, acid-processed sampleGround Arabica with 5% chicory; 2mg powder/100g water, infused for 5-minutes1mg/100g liquid2.4
1980Kasidas and Rose ((Kasidas GP, Rose GA. Oxalate content of some common foods: determination by an enzymatic method. J Hum Nutr. 1980;34(4):255-266))Enzyme (oxalate decarboxylase) assay modified for food analysisNescafe Instant3.2mg/ liter
prepared 0.5g powder per 100ml water
0.8
1992/1993Elmadfa et al (cited in ((Hönow R, Hesse A. Comparison of extraction methods for the determination of soluble and total oxalate in foods by HPLC-enzyme-reactor. Food Chemistry. 2002;78(4):511-521. doi:10.1016/S0308-8146(02)00212-1)))UnknownUnknown1mg/100g brewed2.4
1995McKay et al ((McKay DW, Seviour JP, Comerford A, Vasdev S, Massey LK. Herbal Tea: An Alternative to Regular Tea for those who Form Calcium Oxalate Stones. Journal of the American Dietetic Association. 1995;95(3):360-361. doi:10.1016/S0002-8223(95)00093-3))Enzyme assayMaxwell House Drip1.6 mg per 250ml (8.4 ounces) brewed.1.5
1997Clinic Ciba-Geigy (cited in ((Hönow R, Hesse A. Comparison of extraction methods for the determination of soluble and total oxalate in foods by HPLC-enzyme-reactor. Food Chemistry. 2002;78(4):511-521. doi:10.1016/S0308-8146(02)00212-1)))UnknownUnknown1mg/100g brewed2.4
2002Hönow and Hesse ((Hönow R, Hesse A. Comparison of extraction methods for the determination of soluble and total oxalate in foods by HPLC-enzyme-reactor. Food Chemistry. 2002;78(4):511-521. doi:10.1016/S0308-8146(02)00212-1))High Performance Liquid Chromatography (HPLC) with Enzyme-ReactorBrewed 30g coffee per Liter0.5 – 0.7 mg/100g brewed1.4
2004Galli and Barbas ((Galli V, Barbas C. Capillary electrophoresis for the analysis of short-chain organic acids in coffee. Journal of Chromatography A. 2004;1032(1):299-304. doi:10.1016/j.chroma.2003.09.028))Capillary electrophoresisRoasted Colombian25.6mg/100g ground coffee (not brewed)1.8
est. for standard brewed equiv.: 30g per liter water
2004Galli and Barbas ((Galli V, Barbas C. Capillary electrophoresis for the analysis of short-chain organic acids in coffee. Journal of Chromatography A. 2004;1032(1):299-304. doi:10.1016/j.chroma.2003.09.028))Capillary electrophoresisLyophilised Colombian coffee17mg/100g ground coffee (not brewed)1.2
est. for standard brewed equiv.: 30g per liter water
2010Liebman / VP Foundation ((The Low Oxalate Diet Addendum Summer 2010 - Numerical Values Table. The VP Foundation Newsletter. 2010;(34) ))Capillary electrophoresis or enzymatic assay (not specified)Starbucks4.3 mg/100g10 (“short”)
2010Liebman / VP Foundation ((The Low Oxalate Diet Addendum Summer 2010 - Numerical Values Table. The VP Foundation Newsletter. 2010;(34) ))Capillary electrophoresis or enzymatic assay (not specified)Starbucks20 mg/100g47 (“short”)
Coffee urns with overlaid table of oxalate content by cup volume.

Low-Hanging Fruit: Rotten or Not!

Let’s take a close look at the two studies that report that coffee is very high in oxalate.

If you’re expecting the latest publication to offer a definitive answer, you will be misled when you find the 2012 article from Elzbieta Rusinek ((Rusinek E. Evaluation of soluble oxalates content in infusions of different kinds of tea and coffee available on the Polish market. Rocz Panstw Zakl Hig. 2012;63(1):25-30)) which reports very high numbers for the oxalate content in coffee (Table 3: Studies Claiming Coffee is High). Rusinek published in a Polish journal that appears in Pubmed (the online research database of the National Institutes of Health). The easiest article to find when you search for “coffee” and “oxalate” is Rusinek’s. When you look over Table 2, you’ll see that the studies by McKay and by Hönow and Hesse don’t use the word “coffee” in the title of their articles, nor do they have coffee as a key word, making those articles difficult to find.

In addition to being the easiest to find, the full text of the Rusinek article is also freely available to anyone with an internet connection because the journal is an “open access” publication where all articles are free to download. In stark contrast to being free and accessible, the majority of bio-medical studies are issued by publishers expecting payment from readers. if you’re not affiliated with a university (which may pay hundreds of thousands of dollars for subscriptions), you might have to pay $35 or $40 dollars to read or download a single paper, such as the Hönow and Hesse article. Such articles are described as being behind a “paywall”.

How do we explain these very different results?

The trouble with the 2012 Rusinek study is that it seems to be junk. However, that is not obvious to non-chemists.  I’ve reported Rusinek’s results, and the results from another Polish study that she was emulating methodologically, in Table 3.  Those results state that brewed coffee has 71 to 114 mg of oxalate per cup, and that instant has 110 to 361 mg of oxalate per cup.

All the other recent studies (since 1990) have found coffee to have 1.5 – 2.5mg of oxalate per cup. These two Polish studies report that coffee is nearly forty times higher than all previous studies! Even though Rusinek herself was scratching her head over the vast disparity of her results, she made no effort to determine why her results differed and she published them anyway. With mushy language, she offers readers a vague excuse for her results and their “apparent divergence”; here’s the full passage:

“It is difficult to compare the studies presenting the results of the soluble oxalates analyses in the instant and ground coffees with our results because of their apparent divergence. The result of determinations of oxalates content in teas and coffees is influenced by the various analytical methods of different sensitivity used, as well as processes related to acquisition followed by burning, grinding and mixing procedures, extraction conditions and the initial mass of the sample.”

Rusinek, E (2012) ((Rusinek E. Evaluation of soluble oxalates content in infusions of different kinds of tea and coffee available on the Polish market. Rocz Panstw Zakl Hig. 2012;63(1):25-30)), p. 29

Table 3

Studies Claiming Coffee is High In Oxalate

Hint: Do not believe them!
YearReferenceAnalytical MethodVarieties TestedData as ReportedMg Per 8 ounce (237 ml) serving
2010Sperkowska and Bazylak ((Sperkowska B, Bazylak G. Evaluation of oxalate content in brews of black teas and coffees available in Poland. Nauka Przyroda Technologie. 2010;4(3):#42. doi:10.17306/J.NPT.2010.3.42))Potassium Permanganate TitrationVarious ground available in Poland 47.94 mg/ 100g brewed; 796 mg/100g dry114 (brewed)
2010Sperkowska and Bazylak ((Sperkowska B, Bazylak G. Evaluation of oxalate content in brews of black teas and coffees available in Poland. Nauka Przyroda Technologie. 2010;4(3):#42. doi:10.17306/J.NPT.2010.3.42))Potassium Permanganate TitrationVarious instant coffees available in Poland152.19 mg/100g prepared; 2536 mg/100g dry361 (reconstituted instant)
2012Rusinek ((Rusinek E. Evaluation of soluble oxalates content in infusions of different kinds of tea and coffee available on the Polish market. Rocz Panstw Zakl Hig. 2012;63(1):25-30))Potassium Permanganate TitrationVarious ground and instant available in Poland18-40 mg /100g for brewed and 37-56 mg/100g for reconstituted instant.71 (brewed)

110 (reconstituted instant)

Exposed: Bad Methods, Laziness and Sloppiness

To understand why Rusinek’s article is bad science, the next sections of this post consider her poor choice of method, her failure to consider other methods, and errors of fact in her paper. If you don’t have patience for learning about the science, you can skip to the last section on how to make sense of oxalate data.

Permanganate Titration is an Unreliable Method for Measuring Oxalate

Truth be told, it’s pretty likely that the discrepancy begins with the fact that Rusinek (and Sperkowska and Bazyluk, the other paper in Table 3) used an outdated analytic method called permanganate titration. This method uses a titrant, permanganate, to generate a litmus-like test of oxalate content. The persistence of a light pink color indicates that the reaction of the permanganate with the oxalate is complete. Here is Rusinek’s description: “Titration in hot temperature was conducted with 0.02 N solution of potassium permanganate until pink color appeared and remained for about 1 minute.” p.27

There are several inherent problems with permanganate titration. For one, it is very easy to over-estimate the amount of the material (oxalate in this case) that is being sought with this method. Lab instructions for performing this test explain that the overestimate happens because the permanganate ion is able to “autocatalyze” its own destruction which requires additional (excess) permanganate titrant to reach the endpoint. The oxalate content is determined by measuring how much of the titrant was consumed, so if the permanganate consumes itself the result is going to overstate the amount of oxalate.

But there are other problems with the permanganate titration method. In their 1980 study on oxalate in foods, GP Kasidas and GA Rose ((Kasidas GP, Rose GA. Oxalate content of some common foods: determination by an enzymatic method. J Hum Nutr. 1980;34(4):255-266)) point out that “…substances such as citrate could be extracted with oxalate and might have interfered with the subsequent precipitation and titration with permanganate.”2 But you can go back 20 years earlier and see that the perils of using the permanganate method were already well-known by the early 1960s. At that time UK-based leaders in the oxalate field, PM Zarembski and A Hodgkinson ((Zarembski PM, Hodgkinson A. The oxalic acid content of English diets. British Journal of Nutrition. 1962;16(01):627. doi:10.1079/BJN19620061)), concluded that alternative colorimetric procedures are less subject to processing-related issues and therefore preferred over the permanganate titration method.

Rusinek does not explain the reasons for choosing an inferior method of analysis that had been out of favor for about 50 years prior to her publication. We can safely conclude that Rusinek’s analytical methods contributed to her wildly skewed results. Given her poor choice of method and lack of comparison to more widely accepted methods, Rusinek’s results can confidently be classified as spurious.

Good Scientists Study their Methods, not just their Samples

It is interesting to compare Ruth Hönow and Albrecht Hesse’s 2002 article ((Hönow R, Hesse A. Comparison of extraction methods for the determination of soluble and total oxalate in foods by HPLC-enzyme-reactor. Food Chemistry. 2002;78(4):511-521. doi:10.1016/S0308-8146(02)00212-1)) to Rusinek’s to get a sense of what happens with better science.

In the Department of Urology at the University of Bonn (Germany), Hönow and Hesse sought to validate a new, simpler method for testing oxalate content in food. They also explicitly wanted to determine if or when artifacts of the new testing process could skew their results. And when they tested cherries, they found that for some reason their approach led to higher estimates of oxalate content than previously reported. Instead of brandishing their new findings as “truth”, they did a detailed examination of what might have led their method to “go wrong”, including testing with an alternate method. The result is honest science, and a paper that not only reports believable data obtained using a credible method, but also carefully explains the advantages, pitfalls and limitations of the method.

Errors in Citing Previous Studies

Apart from the poor choice of analytic technique and lack of critical examination of the method and the results, there is one more reason to distrust Rusinek’s report. Her results for coffee deviated massively from every previous study. But in reporting the previous studies, she made misstatements that downplay just how big the deviation is.

First, she claimed falsely that Hönow and Hesse found an oxalate concentration of “10.6 mg/100 cm3 of infusion” (p. 29). In fact, they reported 0.5 to 0.7 mg/100g (see Table 2 above). (For purposes of comparison, 100 cm3 is the same as 100 ml, which for brewed coffee weighs almost exactly 100g, so the reported oxalate content is all on the same basis.)

Rusinek invented a number (10.6mg/100 cm3) that is twenty times larger than the real number (0.5 to 0.7 mg/100g). In doing so, Rusinek implied that her results are two to four times higher than Hönow and Hesse. However it’s much worse than that. If she were honest about the numbers, Rusinek would have to admit her results are 50 times higher: 71 mg per cup versus 1.4 mg per cup.

Our sloppy researcher makes another important citation mistake as well: “[C]onducted in the Sixties Zarembski and Hodgkinson’s studies on oxalic acid in the English diets the oxalates were at the level of 57.00 mg in the infusion of instant coffee (emphasis mine) ‘Nescafe’ from the Arabica beans which was prepared from 2 g sample soaked for 5 minutes with 100 cm3 water at 40°C.” But as shown in Table 1, the article reported 57mg for the instant coffee powder and not the infusion. Moreover, Zarembski and Hodgkinson did not analyze the prepared instant coffee, only the powder. The statement regarding their preparation method is also a “miscommunication”: the sample preparation method Rusinek describes is the one that Zarembski and Hodgkinson used for brewed coffee, not instant.

In her defense, Rusinek’s mistake is easy to make. Zarembski and Hodgkinson reported brewed coffee results on the basis of milligrams per liter of brewed coffee, yet they reported instant coffee on the basis of milligrams per 100g of dry powder.  And I suspect the same mistake is probably happening in patient education materials like those in Table 1 when they decide that instant coffee is spectacularly high in oxalate: they are misinterpreting data presented as oxalate in powder or dry material as if it were the value for the prepared drink. If you’re making a cup of instant coffee from two grams of powder, and the powder has 57mg per 100g, you’re only getting 1.14mg of oxalate in that cup!

I’m not convinced that Rusinek’s sloppiness is entirely innocent. The effect of both these errors is to understate the magnitude of the discrepancy between her results and respected prior research by almost two orders of magnitude.

But Wait! Isn’t There Another Study Saying Coffee is High?

One more reference offered by Rusinek deserves comment (and inclusion next to her results in the Table 3 “Hall of Shame”). In support of her findings, Rusinek cites a 2010 article by Sperkowska and Bazylak published in another Polish journal ((Sperkowska B, Bazylak G. Evaluation of oxalate content in brews of black teas and coffees available in Poland. Nauka Przyroda Technologie. 2010;4(3):#42. doi:10.17306/J.NPT.2010.3.42)) . The study featured in that article appears methodologically identical to Rusinek’s: obtaining coffee and tea samples from local stores, brewing them up, and analyzing them with a harsh preparation process followed by permanganate titration for the measurement step.

Because the Sperkowska and Bazylak article is only available in Polish, I won’t take it on in detail. In the abstract (available in English), their tests found the amount of oxalate in instant coffee powder to be 25.36mg/g of dry mass, or 2.536 grams per 100 grams. In other words, they claim that 2.5% of the instant powder (by mass) is pure oxalate. If instant coffee really were that high, surely someone else using other methods would have noticed! And the vendors would probably make more money selling it as a cleaning product to remove stains from your coffee cup than as a food.

Why were these authors confused? Did they make mistakes? Did they lie? Did they have bad editors? Or did none of them really care what they were publishing? Regardless of how it happened, the bottom line is: low quality papers get accepted and published by seemingly respectable journals.

Other False Claims that Coffee is High in Oxalate

Another article available on Pubmed states bluntly in its title that coffee is a significant source of dietary oxalate. The reference is Gasińska and Gajewska (2007) ((A Gasińska, D Gajewska, Tea and coffee as the main sources of oxalate in diets of patients with kidney oxalate stones. Rocz Panstw Zakl Hig. 2007;58(1):61-7)) entitled “Tea and coffee as the main sources of oxalate in diets of patients with kidney oxalate stones.” (I presume it’s an odd coincidence that this study was published several years earlier in the same Polish journal as Rusinek’s later study. We’ll leave it to someone else to diagnose the curious and apparently unique compulsion for Polish researchers to publish claims that coffee is high in oxalate!)

Gasińska and Gajewska did not conduct any oxalate testing of foods eaten by kidney stone sufferers. Instead, the 2007 study surveyed kidney stone patients (using an unspecified food-frequency questionnaire and 3-day food record) about their diets, and used other published oxalate content numbers to estimate how much oxalate the patients had been eating and from what sources. They offered no real detail about how they performed this magic trick. The Food-Frequency Questionnaire (FFQ) method is rife with pitfalls. For one, FFQs are not designed to distinguish between high and low oxalate foods. For example, spinach and arugula (opposite ends of the spectrum of oxalate content) are considered the same food type; and how much did you eat last year anyway?! Let’s not go any deeper into that annoying topic!

Here’s the stinker: Gasińska and Gajewska stated that their number for coffee oxalate content came from the 1995 McKay et al study ((McKay DW, Seviour JP, Comerford A, Vasdev S, Massey LK. Herbal Tea: An Alternative to Regular Tea for those who Form Calcium Oxalate Stones. Journal of the American Dietetic Association. 1995;95(3):360-361. doi:10.1016/S0002-8223(95)00093-3)). Specifically, they write: “The intake of oxalate was estimated on the basis of [a] table with oxalate concentration in tea and coffee by McKay et al” (Gasińska and Gajewska, p.62). But the McKay study (see Table 2 above) showed that coffee was very low! And the problem is not just that Gasińska and Gajewska misread the data table from McKay. They apparently also didn’t read the article text, where McKay et al state bluntly “Coffee prepared by the drip method was also found to have a low oxalate content–similar to that of herbal teas” (McKay et al, p.361).

So clearly the editors and reviewers of the Gasińska and Gajewska article did a terrible job of fact-checking. (For crying out loud, people, how can you put “coffee” in the title and not check the source?) At best, their article might support the assertion that tea is a major source of dietary oxalate. But that’s not news, and their coffee claim amounts to garbage.

These problematic articles that put the word “coffee” in the title are free. They appear in a seemingly legitimate journal, and in the index on Pubmed, so they must be true, right? Almost no one takes the time to correct the record or have these studies retracted.

And that, dear internet, is how bad science takes flight and lives on and on and on.

How do you make sense of oxalate data?

A lot of the information on the internet about oxalate content for any food (not just coffee) is problematic. The USDA table, for example, is filled with errors and only offers a tiny set of foods. Mistakes get introduced into the record as a result of a combination of outdated or inaccurate testing, bad math (and misinterpretation of what is actually being reported), and poor availability of the science. Even in good research, the numbers are often not reported in units that dietitians and consumers can use directly.

Because of the variability in testing procedures and in the foods themselves, there is always some uncertainty. It would be great if there were programs in operation that would repeatedly:

Oxalate content of Starbucks lattes in different sizes.
Flavored Coffees are Not Necessarily Low in Oxalate
  • Sample lots of common foods;
  • Be specific about the botanical variety being tested and its state of freshness and ripeness;
  • Describe in detail the culinary preparation methods;
  • Test the foods multiple times for oxalate content using a variety of analytical methods;
  • Describe the methods in detail, and
  • Present the results in a format that can be used to calculate dietary intake of oxalate.

For now, we’ll just have to keep making do with what has been reported by responsible researchers: plain coffee, even instant, has under 3mg of oxalate per cup. Let’s hope that the growing interest in the benefits of low-oxalate eating will inspire better standards and more publication of results that are reliable. We should also call attention to bad data on websites (and get the bad data off the USDA list of oxalate content).

Thanks for making it all the way through this technical article. I hope it is a valuable example of how bad science is abundant and problematic.

Disclaimer

I want to point out explicitly that I am not myself a coffee-drinker, and I wouldn’t personally recommend coffee to anyone. I’m not “defending” it because I want to drink coffee, but rather because I have a strong commitment to convey complete, honest, and useful information (and call “BS” when I see it).

Search on SallyKNorton.com

Shopping Cart

Number of items in cart: 0

  • Your cart is empty.
  • Total: $0.00
  • Checkout
Click to sign up for email list

Upcoming Events

  • Group Meeting and Presentation

    March 31, 2023 @ 5:00 pm - 7:00 pm
    Register at https://sallyknorton.com/support
    See more details

  • Group Meeting and Presentation

    April 7, 2023 @ 1:00 pm - 3:00 pm
    Register at https://sallyknorton.com/support
    See more details

  • Group Meeting and Presentation

    April 14, 2023 @ 10:00 am - 12:00 pm
    Register at https://sallyknorton.com/support
    See more details

  • KetoCon Speaker

    April 21, 2023 @ 9:00 am - April 23, 2023 @ 10:00 am

    See more details

Connect

  • Home
  • About
  • Table of Contents
  • Shop
  • Recipes
  • Support
  • Blog
  • Contact

Visit Sally’s Other Sites

  • YouTube
  • LinkedIn
  • Facebook
  • Twitter
  • Instagram

Copyright © 2023 — Sally K. Norton • All rights reserved.


Loading Comments...